IB Statistics and Probability Problem 006
A scientist studies \(100\) female fish and \(100\) male fish. She measures their length (rounded to the nearest centimetre). The results are shown in the following box-and-whisker diagrams.
Female fish

Male fish

- Find the range of lengths of all \(200\) fish.
Four cumulative frequency curves are shown below.
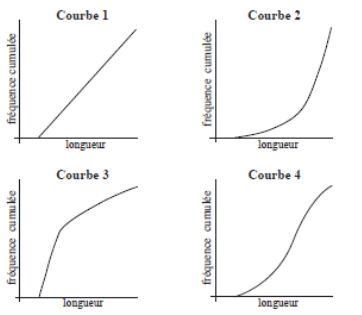
- Which curve best represents the lengths of the female fish?